Metrics
Prometheus
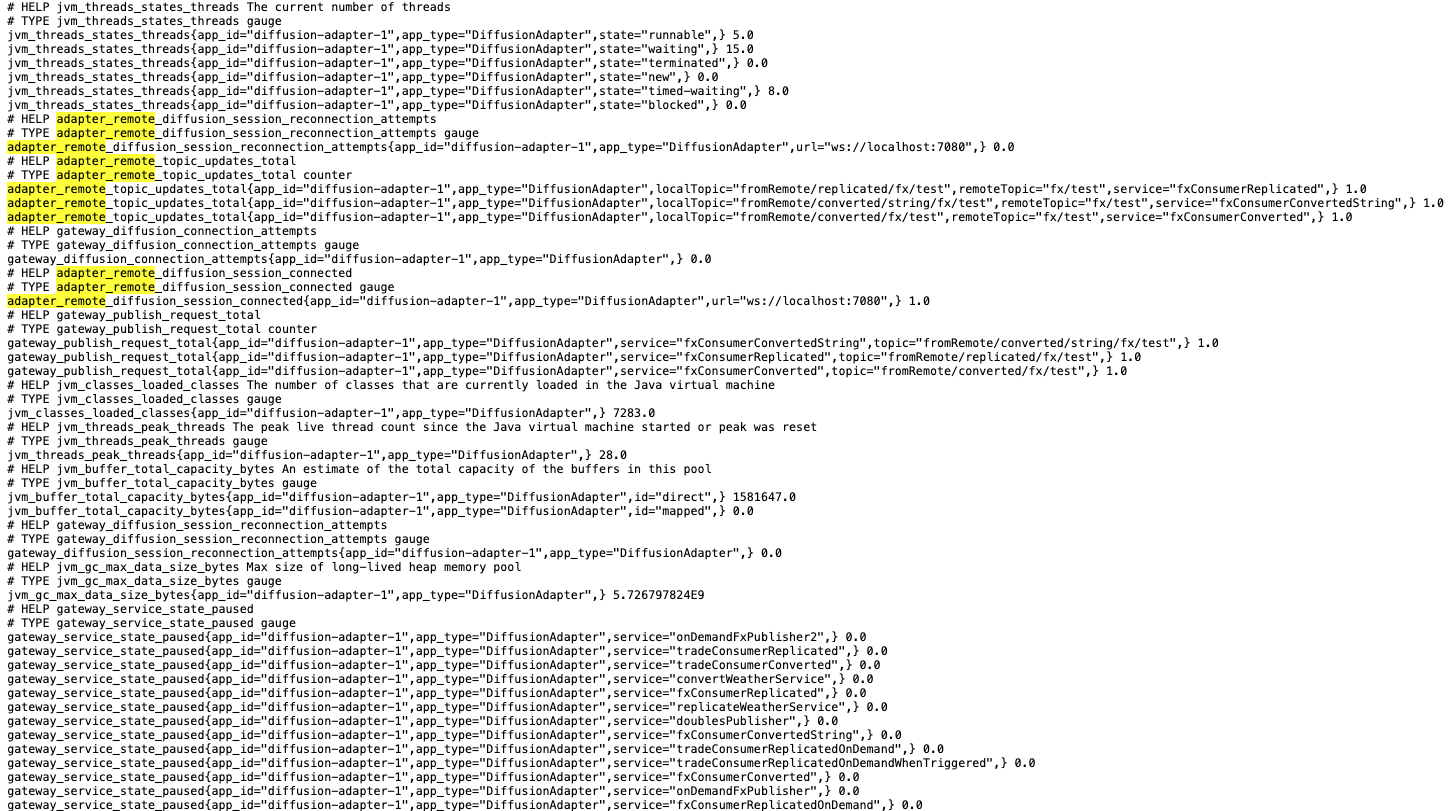
The Diffusion adapter exposes Prometheus metrics, enabling metrics to be scraped and visualized in a monitoring dashboard such as Grafana.
By default, port 8085 is exposed for Prometheus metrics and can be accessed with:
However, the port and path for Prometheus metrics can also be configured via the configuration file in the global configuration section for the application, as follows:
"global": {
  "framework": {
    "metrics": {
      "enabled": true
    }
  },
  "application": {
    "prometheus": {
      "port": 8081,
      "path": "/metrics"
    }
  }
}
Example:
An example of metrics exposed to Prometheus is shown below:
JMX
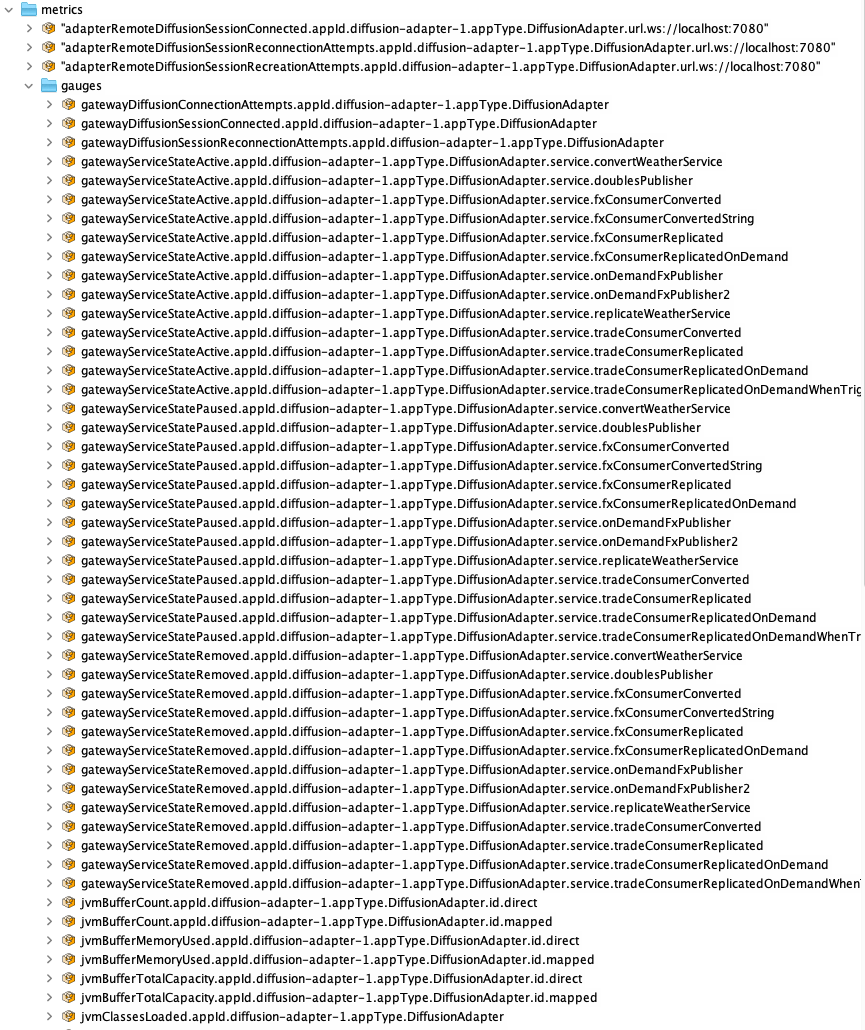
The Diffusion adapter’s JMX MBeans can be accessed using any JMX-capable tooling like JConsole or JProfiler.
JMX metrics are not enabled by default. To
enable the JMX metrics, the jmx configuration parameter in the global application configuration should be set to true as follows:
"global": {
  "framework": {
    "metrics": {
      "enabled": true
    }
  },
  "application": {
    "prometheus": {
      "port": 8081,
      "path": "/metrics"
    },
    "jmx": true
  }
}
Example:
An example of metrics exposed via JMX beans in Jconsole is shown below: