Prometheus
The Kafka adapter exposes Prometheus metrics, enabling metrics to be scraped and visualised in a monitoring dashboard such as Grafana.
By default, port 8085 is exposed for prometheus metrics and can be accessed with:
However, the port and path for Prometheus metrics can also be configured via the configuration file in the global configuration section for the application, as follows:
"global": {
  "framework": {
      "metrics": {
          "enabled": true
      }
  },
  "application": {
    "prometheus": {
      "port": 8081,
      "path": "/metrics"
    }
  }
}
Example:
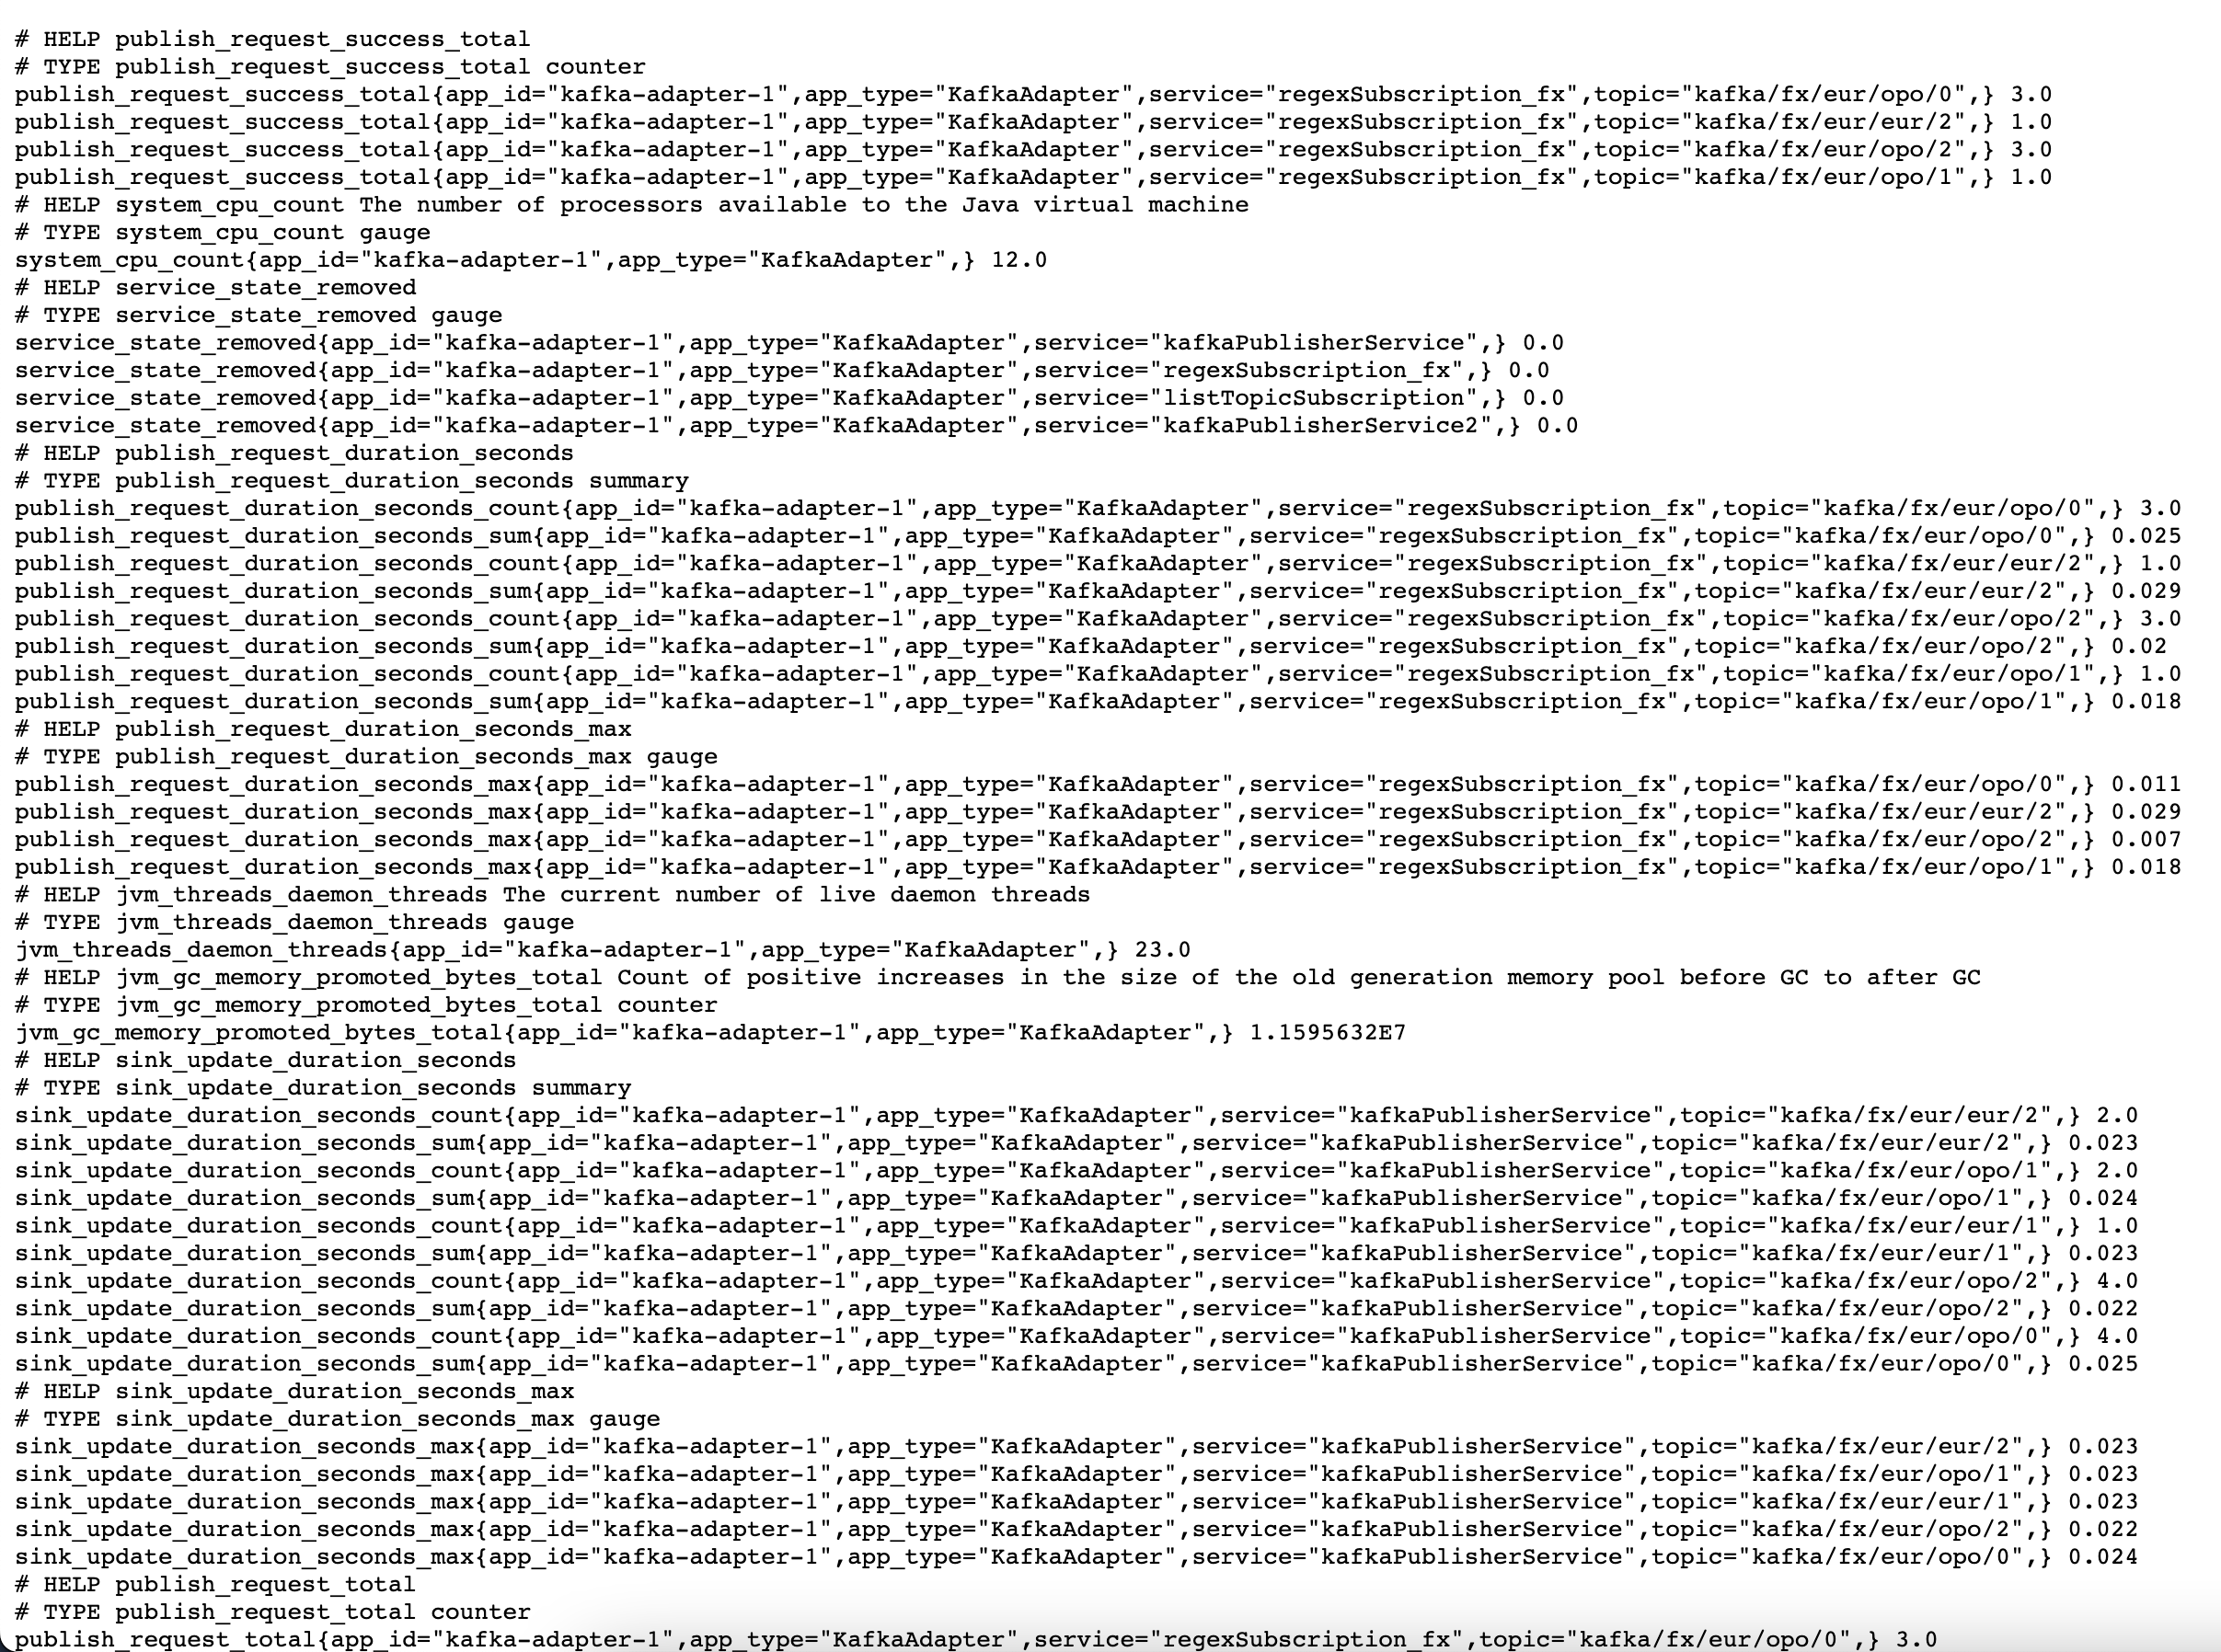
An example of metrics exposed to Prometheus is shown below: