Prometheus
The Redis Adapter for Diffusion can expose Prometheus metrics, often used with a monitoring dashboard such as Grafana.
Prometheus metrics are not enabled by default, and can be enabled with suitable configuration, e.g.
"global": {
  "application": {
    "prometheus": {}
  }
}
By default Prometheus metrics are available at localhost:8085/prometheus
Both the Prometheus metrics port and path can be configured in the global configuration section for the adapter, e.g.:
"global": {
  "application": {
    "prometheus": {
      "port": 8081,
      "path": "/metrics"
    }
  }
}
Example:
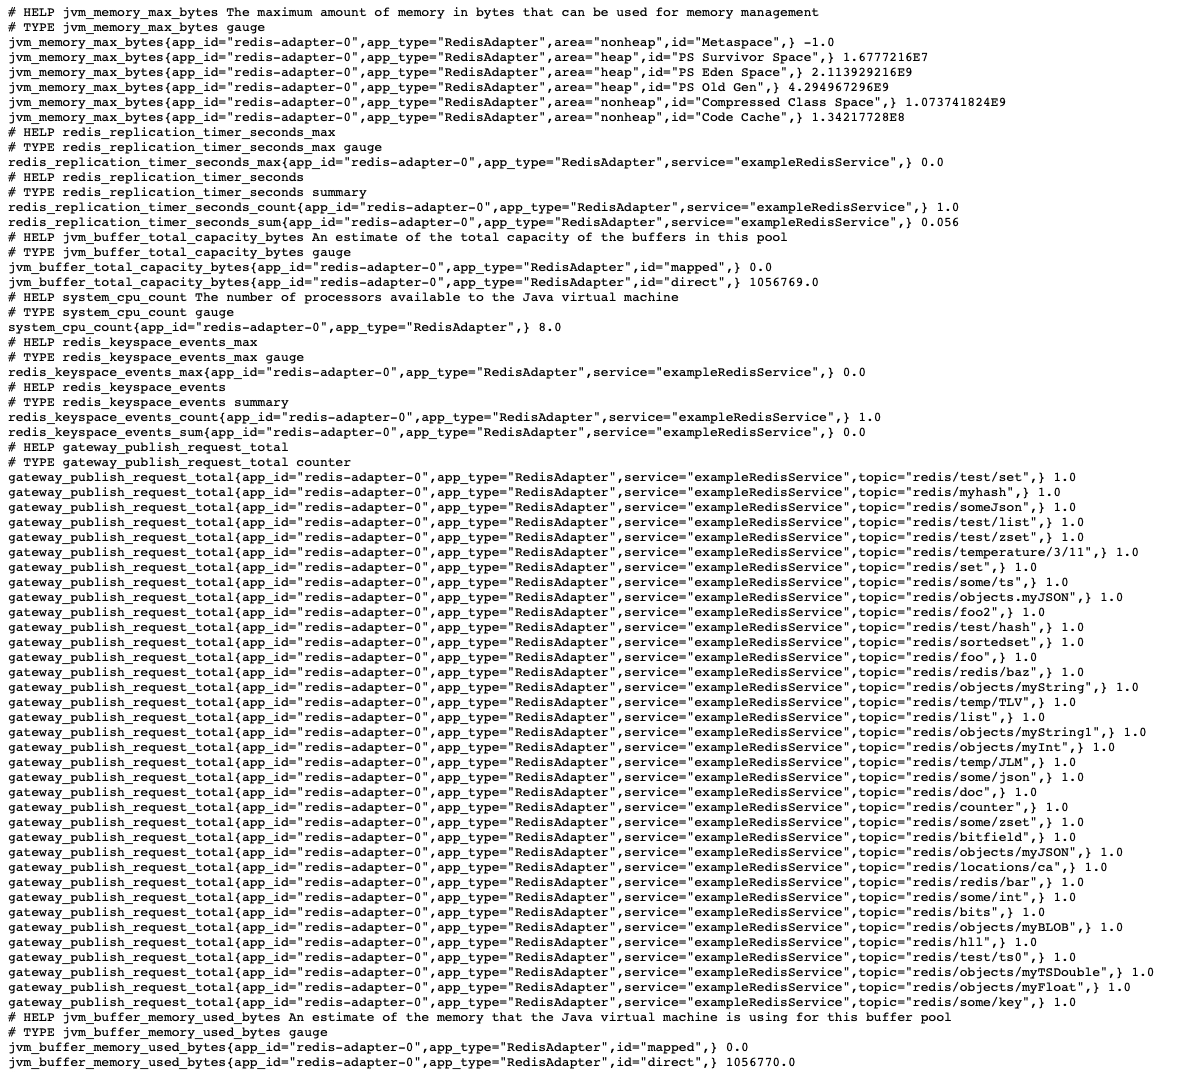
An example of metrics exposed to Prometheus is shown below: